Introduction
Running out of wine at a wine festival is a festival producer’s nightmare. Long lines at popular tasting tables and empty bottles by midday can tarnish the attendee experience and a festival’s reputation. To avoid these pitfalls, leading wine festival producers around the world rely on pour counts and depletion curves – tracking how many pours each vendor serves and how quickly their stock is depleting. By monitoring pours per table in real time, organisers can preempt outages, rebalance staff to where they’re needed most, and gather data to make next year’s festival even better. This article shares practical insights and examples on how tracking pour counts and analyzing depletion curves can transform wine festival operations, from small local events to international wine celebrations.
Understanding Pour Counts and Depletion Curves
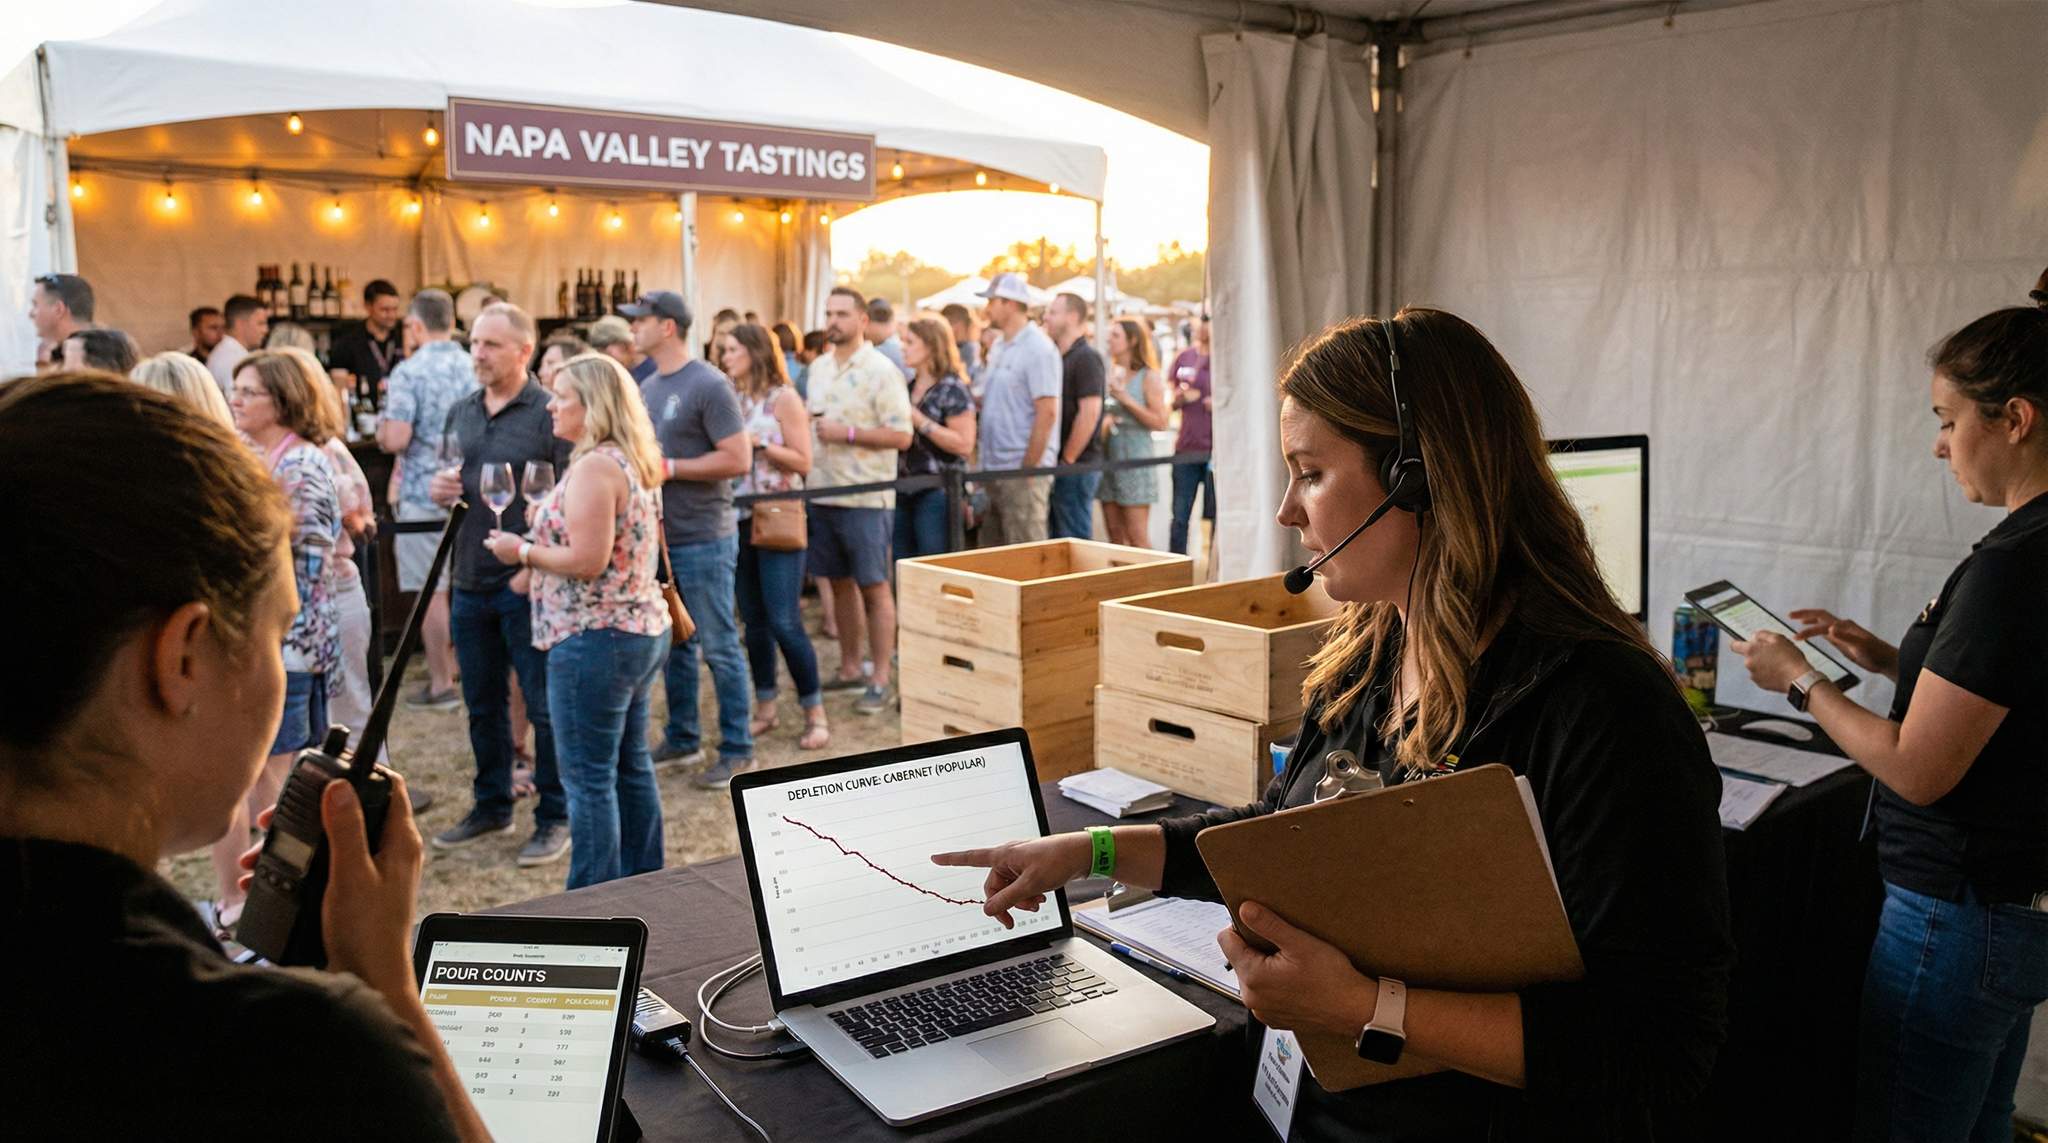
Pour counts refer to the number of wine servings poured at a given table or booth over time. Essentially, it’s a measure of how many tastes each winery or vendor has served. A depletion curve is the visual representation of a vendor’s inventory level over the course of the event – think of it as a graph that slopes downward as bottles are emptied. Steeper curves mean a vendor is pouring rapidly and could run out sooner than expected. Monitoring these metrics gives a festival producer a clear picture of which stands are busiest, which wines are most popular, and how quickly supplies are being consumed.
For example, imagine a wine festival where Table A (serving a famous Napa Cabernet) pours 100 tastings in the first hour, while Table B (with a lesser-known varietal) pours 30. Table A’s pour count is much higher, and its depletion curve will drop faster. If each bottle yields 25 tasting pours, Table A might burn through four bottles in an hour. Without intervention, they could run out of wine halfway through the festival day. By contrast, Table B’s stock is depleting slowly. These simple counts and curves provide invaluable foresight – allowing the organisers to respond before a popular booth runs dry.
Why Tracking Pours Matters at Wine Festivals
At any wine festival – whether a local vineyard’s weekend fête or a massive international wine expo – knowledge is power. Knowing how many pours each vendor has given and how fast their wine is disappearing matters for several reasons:
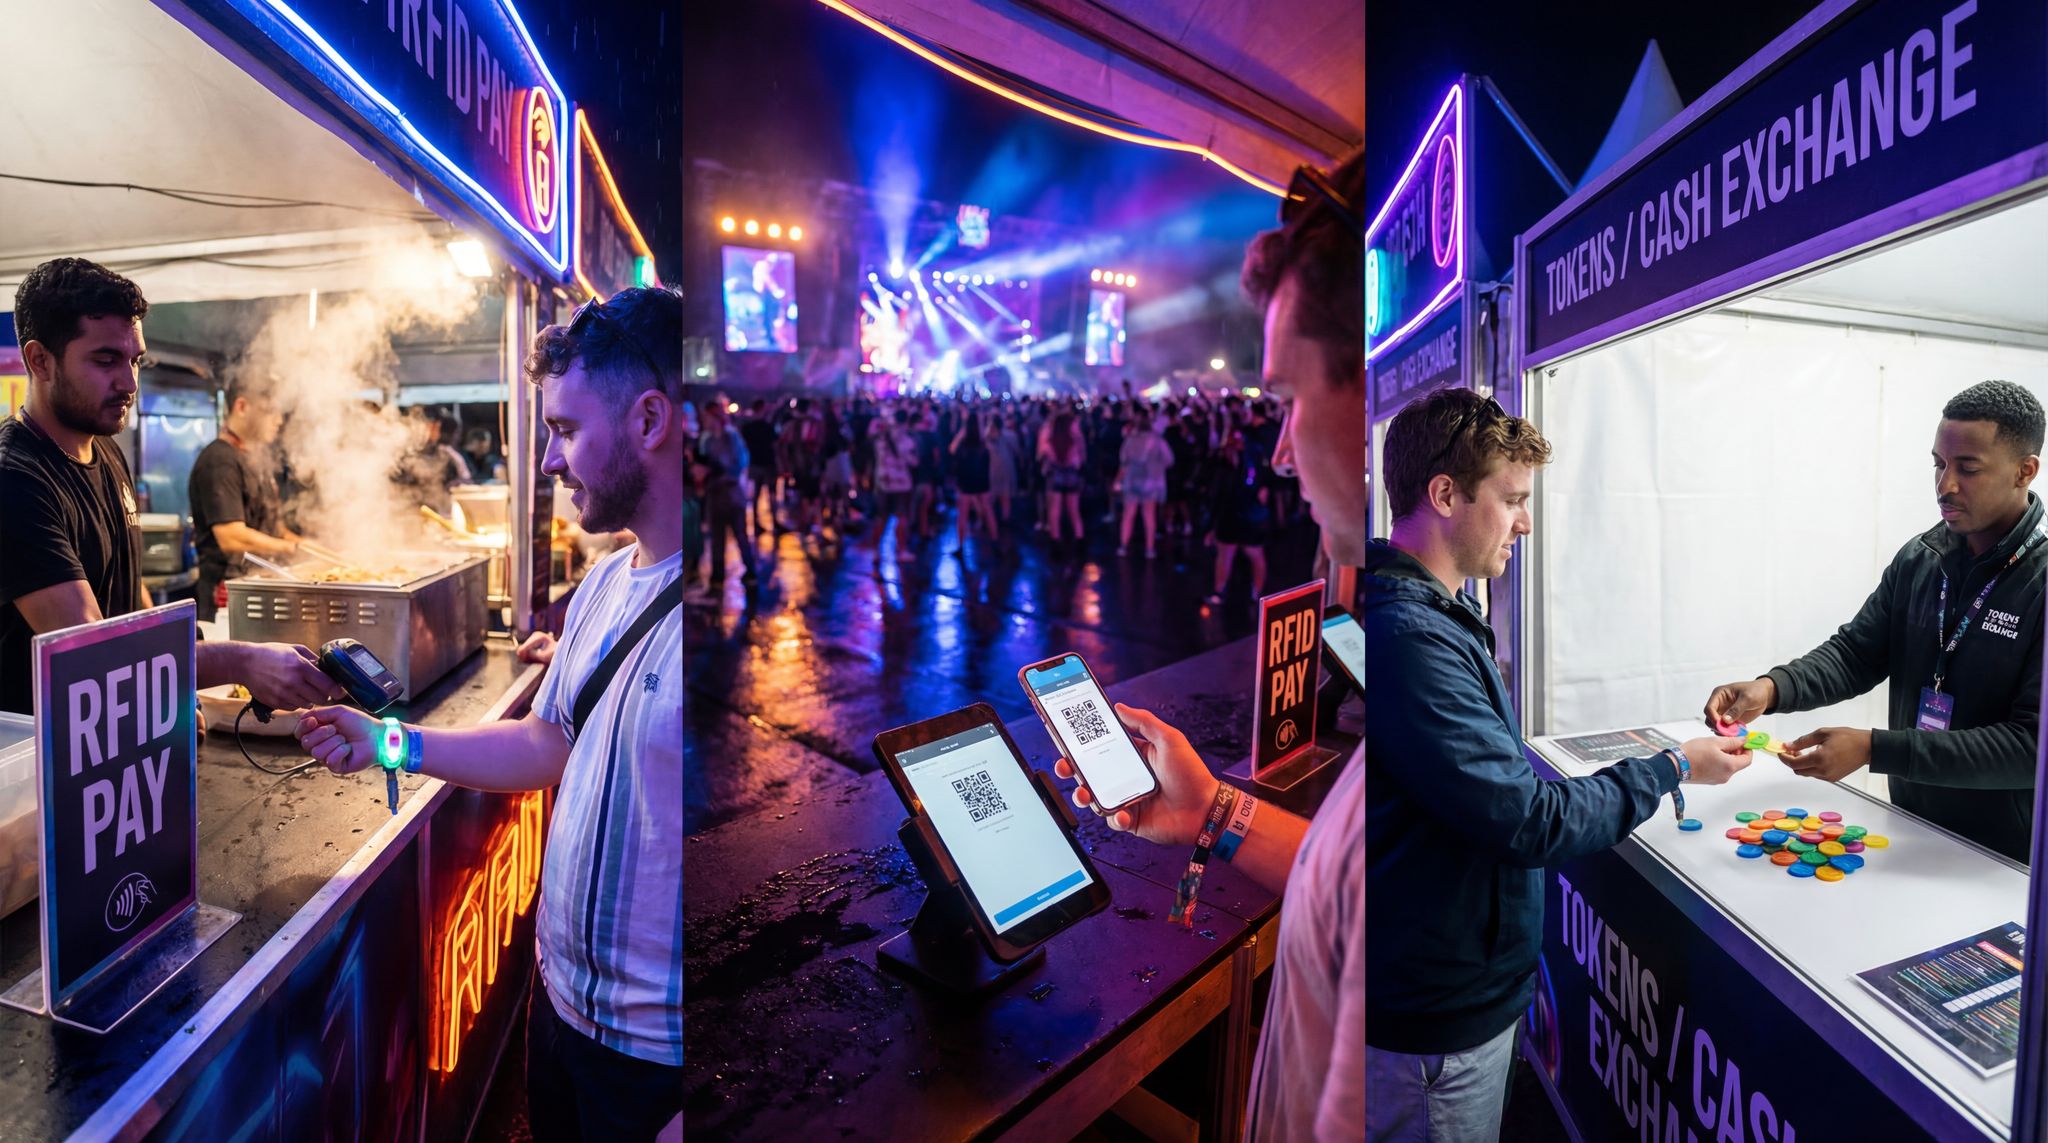
Go Cashless With RFID Technology
Enable contactless payments, faster entry, and real-time spending analytics with RFID wristbands and NFC-enabled ticketing for your events.
- Preventing Product Outages: Nothing disappoints attendees more than reaching a booth only to hear their favourite wine is all gone. Tracking pour counts helps ensure no winery unexpectedly runs out of wine early. If one vendor’s stock is vanishing quickly, organisers can step in to assist (bringing out reserve bottles, adjusting pour sizes, or redirecting crowds) before the booth is dry.
- Balancing the Crowd & Reducing Lines: Pour counts serve as a proxy for crowd size at each table. A high pour count in a short time means a booth is popular – and likely has a long queue. By identifying these hot spots from data, festival staff can rebalance: send additional staff to that table to speed up service, or even diplomatically guide some attendees toward other vendors to spread out the crowd. This proactive approach keeps lines moving and prevents one area from becoming the dreaded “line festival” that frustrates guests and leads to negative reviews.
- Optimising Staff Allocation: Festival budgets often limit the number of staff or volunteers. Using pour data, an organiser can allocate human resources dynamically. For instance, if the Italian wine section is pouring twice as many tastes as the Spanish section, you might shift a couple of staff members to the Italian booths during peak times. This ensures tasting stations aren’t understaffed (which was a complaint at one New York wine fest) and helps maintain a smooth flow, addressing common complaints about understaffed areas. On the flip side, if a winery’s table has very low traffic (low pour counts), some staff there can be re-deployed to busier spots.
- Enhanced Guest Experience: When popular wines stay available throughout the event and lines remain reasonable, guests leave happier. They get to sample everything they came for. By avoiding outages and excessive waits, you’re directly protecting the festival’s reputation and encouraging those attendees to return next year.
Tools and Techniques to Measure Pour Counts
How can an event team actually track pours at each table? There are both low-tech and high-tech solutions, suitable for different scales of festival:
- Manual Tallying: For small boutique festivals or events with limited vendors, a simple manual count can work. Provide volunteers or staff at each booth with a clicker counter to tick every pour, or have them note each bottle opened (e.g., one bottle equals ~25 pours). Regularly collect these counts (say, every 30 minutes) via radio or a runner. This low-tech method is inexpensive and gives a rough real-time indicator of activity.
- Token or Ticket Systems: Many wine festivals use tasting tokens or coupons that attendees exchange for a pour. Not only do tokens help control how much each person drinks, they also serve as a built-in counting system. If Winery X has gone through 300 tokens by mid-event, you know roughly 300 pours were served. Organisers can quickly spot which vendors are likely to exhaust their token allocation and need attention. For example, Taste of Auckland in New Zealand and Toronto’s Food and Wine Expo have used token systems – by collecting tokens periodically, organisers could see which booths were swamped and which were slow, then act accordingly.
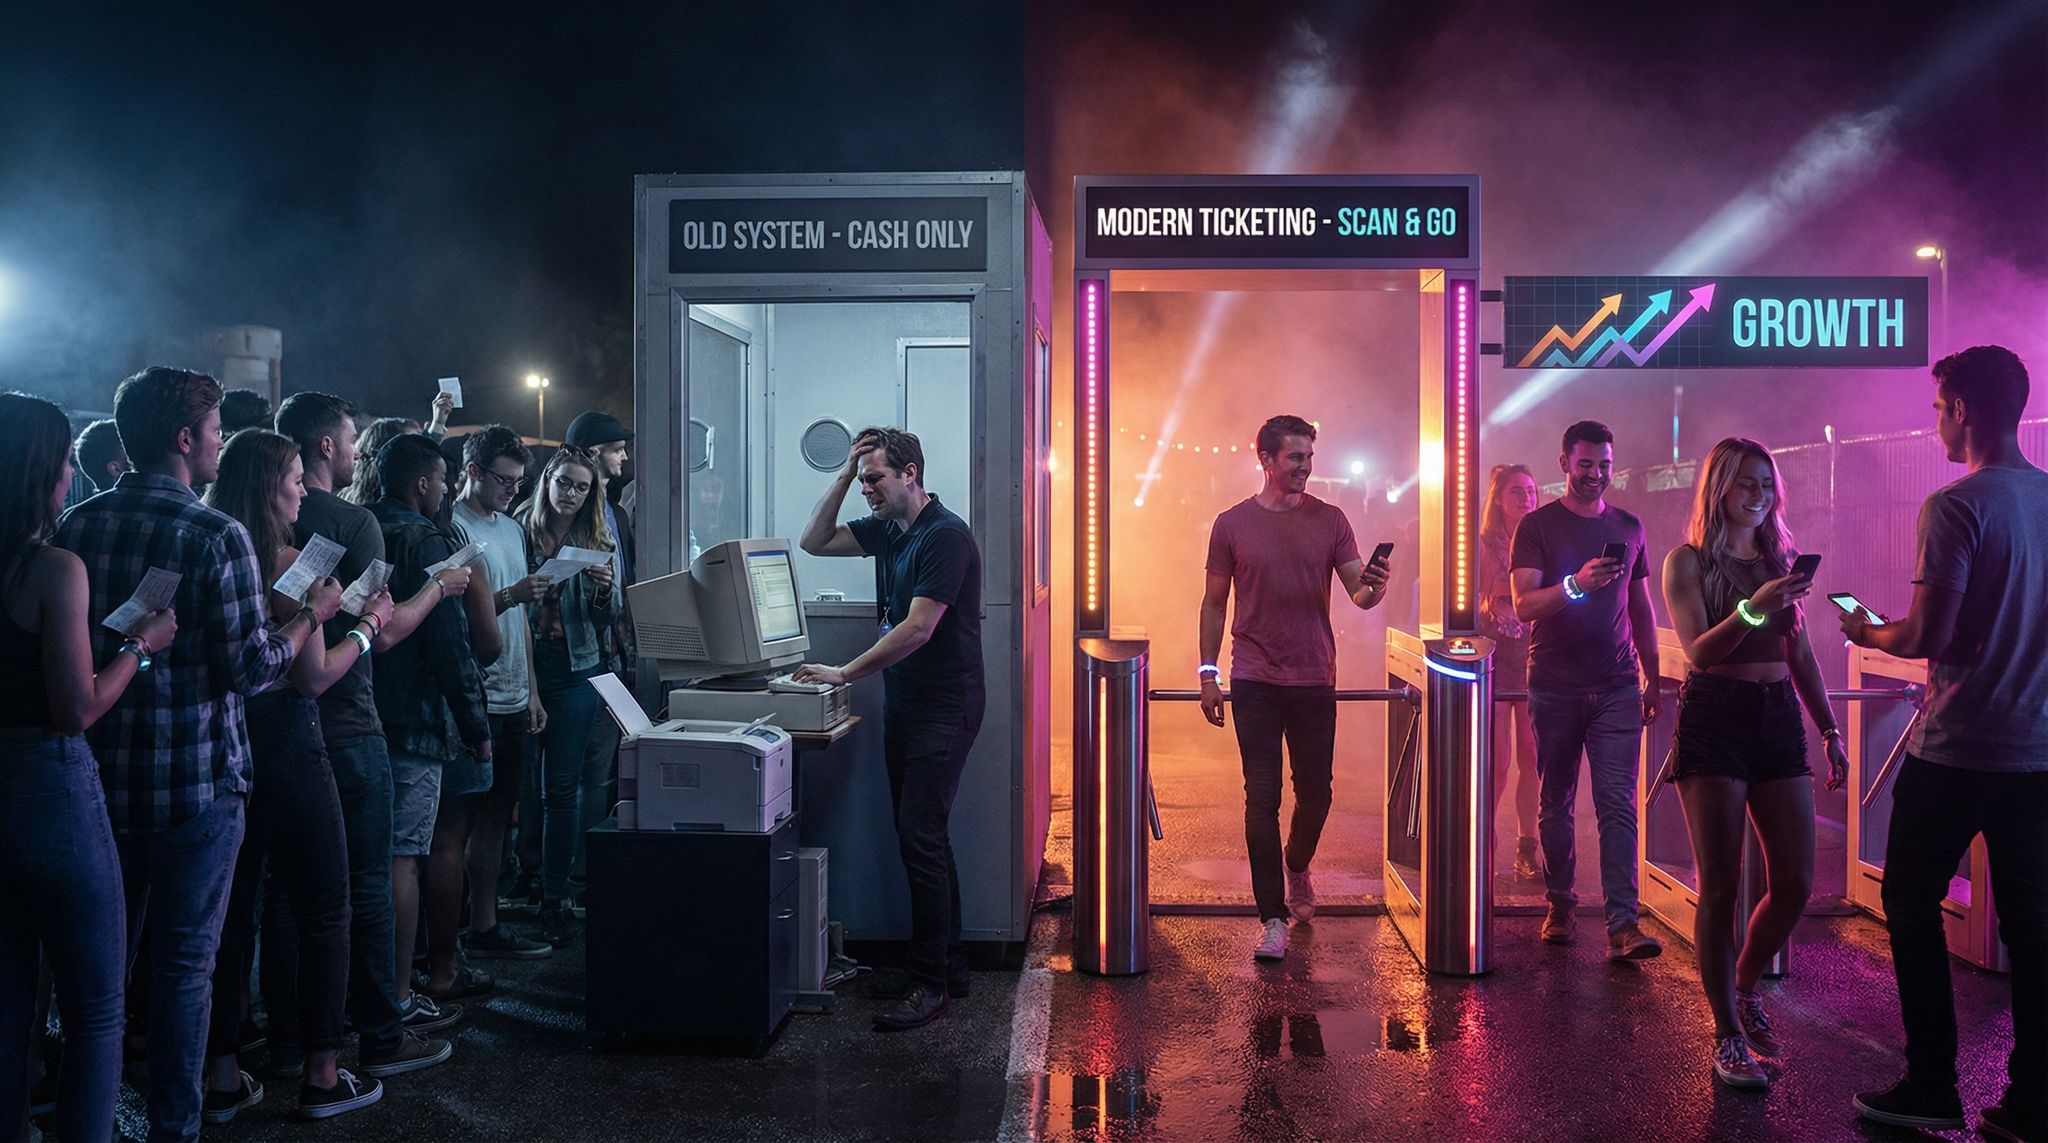
- Digital Scanning and RFID: Larger festivals or those aiming for cutting-edge efficiency might opt for technology like RFID wristbands or QR code scanning. Each attendee receives a wristband or digital “tasting passport” that gets scanned at each booth they visit. This automatically logs a pour in a central system. Ticket Fairy’s wine festival platform, for instance, offers digital tasting passports and unique QR codes for each winery station, allowing organizers to easily track which wineries attendees visited. This system provides real-time insights into audience demographics and preferences. Each scan adds to a real-time dashboard of pour counts, creating instant heat maps of popular booths. This kind of system can even enforce limits (e.g., preventing an attendee from returning to the same table too many times) and monitor inventory in real time using comprehensive analytics for each participating winery.
- Mobile Apps for Vendors: Some festivals equip vendors with a simple mobile app or even a shared spreadsheet where they tap a button for each pour. It requires willing participation, but many vendors appreciate the feedback loop. Knowing they’re being monitored can also encourage measured pour sizes and fair sharing of their stock throughout the event duration.
No matter the method, the key is to have a centralised way to compile the data during the festival. A designated team member (or team) should be monitoring the incoming pour counts periodically, almost like an operations control centre for the event.
Planning a Festival?
Ticket Fairy's festival ticketing platform handles multi-day passes, RFID wristbands, and complex festival operations.
Preempting Outages in Real Time
Armed with pour count data and depletion curves (graphs of remaining inventory over time), festival organisers can take quick action during the event to prevent any booth from running out of wine or getting overwhelmed:
- Dynamic Stock Reallocation: If a winery’s table is on pace to run out of their Chardonnay by 3 PM (as indicated by a sharply dropping depletion curve), see if they have more stock on-site or in reserve. Some large festivals keep a small central stash of popular wines or have arrangements for vendors to access extra cases stored nearby. A runner can rush additional bottles to the busy booth before the wines run dry. In the Vancouver International Wine Festival, for instance, staff coordinate with vendors to have extra cases on standby for the most sought-after wines – informed by early-hour pour counts, they know exactly which varietals to fetch more of by midday.
- Adjusting Pour Sizes or Limits: In emergencies where no additional stock is available, communicate with the vendor to perhaps taper their pour size slightly for the remaining time or switch focus to a different wine they have in better supply. Attendees will generally accept a 1.5 oz pour instead of 2 oz if it means more people get to taste. It’s not ideal, but better than a hard “sold out” sign at a booth two hours before closing. Some festivals also institute an attendee pour limit (e.g., a fixed number of tastings per person) to evenly distribute consumption – for example, Sydney’s Good Food & Wine Show uses a ticket bundle that naturally caps how many pours each guest can redeem, ensuring vendors aren’t drained by a few heavy tasters.
- Swapping or Redistributing Stock: If one vendor is running out of Sauvignon Blanc and another vendor nearby happens to have extra (and perhaps a smaller crowd), a bit of behind-the-scenes swapping can save the day. This requires good relationships and trust – something often found in close-knit wine communities. At a regional wine festival in Alsace, France, organisers noted that local wineries were willing to share spare bottles with each other when one ran low on a popular vintage, ensuring every booth stayed operational until closing.
- Communication & Transparency: If a particular wine does run out, use staff to immediately update signage or inform attendees in line to manage expectations. It’s better to redirect them to another great option than let them wait and fume. Proactive announcements (“Our Pinot Noir reserve has been immensely popular – only a few pours left!”) can even spur interest in other varieties or booths. Seasoned festival producers also remind vendors to bring a diversity of products so that if one wine runs dry, they have backups (like offering a different year of the same wine, or another similar varietal) to keep pouring and keep guests happy.
Meanwhile, as these interventions happen, the pour counts also help the team identify where staff should be redeployed. For example, if the data shows the Argentina Region tent is drawing huge numbers, radio some floater staff or volunteers to assist that area. They might help with uncorking bottles, answering questions, or managing the queue – taking pressure off the core vendor staff. This fluid staffing approach is common at large festivals; London Wine Week events have “roaming pourers” on standby who can jump in at busy tables during rush periods. By contrast, if another area has very low traffic (say the Sparkling Wine corner later in the day), you can pull a couple of staffers from there and assign them to busier spots.
Using Data for Next Year’s Wine Allocations and Planning
One of the biggest benefits of tracking pour counts and depletion curves is what you learn for the next edition of the festival. The data gathered becomes a goldmine for planning future events:
- Vendor Selection & Booth Placement: Your pour counts reveal which wineries or wine varieties were the most popular. If French Bordeaux blends accounted for a significant portion of all pours, that’s a sign to invite more Bordeaux producers next year or give that category a larger area. Likewise, if a small boutique winery surprised everyone by being the hit of the festival (consistently long lines and high pour numbers), you might promote them to a more prominent booth location next year – and ensure they bring more wine! Conversely, vendors with very low engagement might need a smaller allocation or could be rotated out in favor of new offerings that excite the crowd.
- Allocating Wine Volume: The depletion curves show exactly how many bottles each vendor went through. This is crucial data to share with the wineries when planning the next event. For example: Winery X poured 15 bottles of their Shiraz and 10 of their Chardonnay to serve ~500 tastings. If they plan to return next year with a similar audience size, they now know to bring at least the same amount, if not more, since demand was high. Festival organisers can provide guidance like, “You were popular – consider bringing 20% more wine next time.” On the organiser side, aggregate data might reveal, say, 2,000 total pours of Pinot Grigio across all vendors – indicating the need to ensure plenty of Pinot Grigio options (and adequate supply) next year.
- Staffing and Layout Improvements: The areas and times where pour counts spiked highlight where more staffing or space is needed. If the Rosé Garden area consistently had congestion around 2 PM, you might schedule a brief entertainment break or wine talk near that time next year to disperse the crowd, and allocate extra volunteers there preemptively. If the evening session saw a surge in dessert wine pours, ensure the dessert wine booths have more cups, napkins, and staff during that window. Essentially, use the data trends to anticipate and smooth out peak demand periods.
- Budgeting and Cost Management: Detailed pour count data helps with budgeting for supplies like glassware, ice, and even water (to rinse glasses or hydrate guests). Knowing that total pours were, for example, 15,000 over the festival, you can estimate how many tasting glasses or disposable cups were actually used (and plan to have a surplus next time). If some wines ran out and emergency restocks were purchased, you can budget for an inventory contingency next year. Additionally, such data can support sponsorship pitches – e.g., being able to tell a glassware sponsor that “We facilitated 15,000 wine tastings last year” is a strong metric to attract support.
- Marketing Insights: What people drink can inform your marketing. If data shows the crowd loved local regional wines more than imports (or vice versa), you can tailor your festival’s marketing to emphasise that strength. For instance, “Back by popular demand – more Napa Cabs and Barossa Shiraz, after they topped last year’s tasting counts!” On the other hand, if a style was underappreciated (perhaps only a few hundred pours of Riesling in total), you might feature a “Discover Riesling” promotion or educational session to boost interest.
Consider the case of the Austin Food & Wine Festival in Texas: After one year where pour tracking revealed Mexican wines were surprisingly popular (consistently high pour counts at those booths), organisers expanded the festival’s “Taste of Latin America” section the next year, inviting more Mexican and South American wineries. They also increased the stock each of those booths could pour by 30%. The result was shorter lines, no outages, and record attendee satisfaction for that section of the festival. The data not only prevented problems but actively guided growth in the direction attendees clearly wanted more of.
Data-Driven Event Marketing
Track ticket sales, demographics, marketing ROI, and social reach in real time. Exportable reports give you the insights to make smarter decisions.
Tailoring Strategies for Size and Audience
Pour count monitoring isn’t one-size-fits-all. A boutique farmers’ market-style wine festival for 300 people will use these concepts differently than a sprawling international wine expo with 50,000 attendees. Organisers must adapt to the scale and the crowd:
- Small Local Festivals: With modest crowds and fewer vendors, personal touch is key. You might have just a handful of staff checking on each booth every hour. Simple tally sheets might suffice for tracking. These festivals often serve a tight-knit community, so engaging volunteers (perhaps local wine club members) to monitor pour counts can double as community involvement. As an example, at the Hawke’s Bay Wine & Food Festival in New Zealand (an intimate regional event), organisers enlist local oenology students as “wine runners” who track bottle usage and fetch more wine from a communal storage when any winery gets low. This not only averts outages but also mentors the next generation in festival operations – a win-win for community engagement.
- Large-Scale Festivals: Big events need more systematic solutions. Technology and a formal operations team become crucial. A central command post with real-time dashboards and radio communications can coordinate dozens of staff. For instance, at Hong Kong’s Wine & Dine Festival, which hosts tens of thousands of attendees, organisers use a custom app to track live tasting tallies at key zones; operations managers can be seen watching metrics on tablets while dispatching teams to hot spots. At this scale, even factors like audience demographics come into play: if data shows younger attendees flocking to experimental wine-cocktail booths in the evening, the organisers might schedule extra support (and stock of those ingredients) during that peak, whereas older daytime attendees might gravitate to classic wine tasting seminars with steadier consumption rates.
- Different Audience Behaviours: A wine festival’s character can vary – some are more about serious tasting and learning, others are essentially parties with wine. The strategy for tracking pours should align with the vibe. At an upscale connoisseur event like the Bordeaux Fête le Vin in France, attendees may sip slowly and discuss, so pour counts climb gradually and outages are less likely with measured consumption. The focus there might be on using data post-event to refine the selection of rare wines. In contrast, at a lively event like SulaFest in India (known for wine plus music and dancing), people might consume faster once the concerts start. Organisers at SulaFest have implemented a token system to cap tastings per person and stationed additional pourers during concert hours to keep up with the higher pace of pouring. By understanding their audience’s rhythm, they use pour count data to ensure safety (avoiding over-intoxication) and that the wine keeps flowing without interruption.
- International and Cultural Considerations: Different countries have different licensing and cultural norms around alcohol service. In parts of the U.S. and Australia, regulations might require tracking how much alcohol is served to each guest for liability reasons. In Europe, rules might be looser but quality expectations higher. As a festival producer, adapt your pour monitoring to meet local requirements. For example, California wine festivals often have volunteer staff at each booth not just to assist but to subtly observe patron consumption levels – effectively combining pour counting with responsible service. In Germany, some wine fests have a tradition of offering full-glass purchases in addition to small tastings; if you operate in such a setting, you’d track bottle sales alongside tasting pours to get a complete depletion picture. Always factor in local nuances when designing your data collection and response plan.
Learning from Successes and Failures
Even seasoned festival producers have learned the hard way about the importance of managing pours:
Need Festival Funding?
Get the capital you need to book headliners, secure venues, and scale your festival production.
- Success Story – Napa’s Winter Wine Carnival: An annual winter wine festival in Napa Valley noticed in early years that a couple of famous wineries always had huge lines and often ran out of their top varietals. In response, the festival introduced a checkpoint: each winery had to report halfway through the event how many bottles they had left. Festival staff used this info to shuffle some extra inventory from less busy tables to the popular ones (with the wineries’ permission). They also started giving “Popular Choice” awards to those top-pour wineries, which encouraged them to bring more stock the next year. The result? In recent editions, no booth has run dry, and wineries compete in a friendly way for who can serve the most tastes – a win for attendees who get to sample everything.
- Cautionary Tale – The Overwhelmed Wine Fest: A real-world example comes from a wine festival in Rochester, New York, where organizers underestimated attendance and did not adjust staffing properly. Attendees dubbed it the “line festival” because nearly every booth was backed up and service was slow, leading attendees to deem the night full of disappointments. Some vendors couldn’t pour fast enough and a few ran out of certain wines early. The backlash on social media was severe, and the event had to issue refunds to placate angry guests, as organizers admitted the event was overpopulated and understaffed. The lesson? If they had tracked the pour counts and crowd flow in real time, staff could have been shifted and announcements made to alleviate the crowding. This fiasco underscores how crucial proactive monitoring is – even mid-sized events can get overwhelmed without it.
- Success Story – Melbourne Food & Wine Festival’s Data-Driven Approach: One of Australia’s premier wine events, the Melbourne Food & Wine Festival, hosts hundreds of tastings citywide, including big public Grand Tasting sessions. Organisers there have embraced data by using digital ticketing and entry scans for scheduled tasting sessions. They track how quickly people move through tasting stations and note which stations hit capacity. Over the years, this allowed them to stagger entry times and place popular wineries at multiple pouring stations to dilute crowds. They also share summary data with all participating wineries (e.g., how many pours each winery served each day), so those wineries come prepared with enough product the next time. This transparency in data has built trust – wineries feel the organiser is a partner in their success, not just someone who rents them a booth.
- Failure to Success – A Turnaround Story: Consider Sea & Vines Festival in McLaren Vale, South Australia, an event that once made headlines for all the wrong reasons, including unruly drunken behaviour and poor control, where media reports blamed drunken behavior on bus groups. In response, organisers implemented stricter tasting limits and introduced a smartcard system to monitor pours per person. They also ensured each winery brought ample stock by using past consumption data to guide allocations. The next year saw a far improved atmosphere – no wine shortages, better-behaved crowds (thanks to controlled service), and a restored festival reputation. The community praised the organisers for learning from the problems and making the event safer and more enjoyable.
By examining such stories, it becomes clear that tracking and acting on pour counts is not just about logistics – it’s about caring for the stakeholders: your attendees (who want a great experience), your vendors (who want to succeed and not be embarrassed by running out), and your staff (who want a manageable workload). It’s a holistic win for everyone involved in the festival.
Frequently Asked Questions
What is a pour count at a wine festival?
A pour count measures the specific number of wine servings dispensed at a vendor table over a set period. This metric allows festival organizers to track real-time consumption, identify popular wineries, and gauge crowd density at specific booths to prevent inventory shortages and manage attendee flow effectively.
What is a depletion curve in event inventory management?
A depletion curve visually represents a vendor’s declining inventory level throughout an event, appearing as a downward-sloping graph. Steeper curves indicate rapid consumption, alerting organizers that a specific wine is selling out quickly. This visual data enables proactive restocking or stock reallocation before a booth runs dry.
How can organizers track wine pours at festivals?
Organizers track wine pours using methods ranging from manual tally counters and ticket collection to advanced digital solutions like RFID wristbands and QR code scanning. High-tech systems provide real-time dashboards and heat maps, while lower-tech options involve collecting tokens or having volunteers log bottle usage at regular intervals.
How can festivals prevent running out of wine early?
Festivals prevent early wine outages by monitoring real-time depletion curves to identify vendors consuming inventory too quickly. Strategies to preempt shortages include deploying runners with reserve stock, facilitating stock swaps between friendly vendors, or temporarily adjusting pour sizes to extend the remaining supply until the event concludes.
Why is tracking pour counts important for wine festivals?
Tracking pour counts is essential for preventing product outages and managing crowd flow, ensuring popular booths remain stocked and accessible. This data serves as a proxy for crowd size, allowing organizers to reduce wait times, optimize staff deployment to busy areas, and ultimately protect the event’s reputation and guest satisfaction.
How does pour data improve festival staff allocation?
Pour data improves allocation by highlighting high-traffic zones in real time, allowing organizers to dynamically redeploy volunteers or roaming pourers to overwhelmed booths. Conversely, staff can be shifted away from low-traffic areas, ensuring resources are concentrated where they are needed most to maintain service speed and reduce lines.
How does pour count data help plan future wine festivals?
Historical pour count data informs future planning by revealing which varietals and vendors were most popular, guiding accurate inventory volume and booth placement for the next edition. Organizers use these insights to adjust wine allocations, refine marketing strategies based on consumption trends, and budget accurately for supplies like glassware.
What are the benefits of using RFID for wine festivals?
RFID technology streamlines wine festivals by automatically logging every pour to create real-time consumption dashboards and crowd heat maps. This digital approach eliminates manual counting errors, provides instant insights into audience preferences, enforces tasting limits to ensure responsible service, and allows for precise inventory tracking across all vendor stations.