Introduction
Electronic dance music events thrive on energy, safety, and attendee satisfaction. To ensure a healthy dancefloor and a successful event, festival producers must look beyond basic revenue figures. They need to track key performance indicators (KPIs) that capture both the crowd’s well-being and the festival’s commercial outcomes. By measuring the right metrics – from crowd density to queue times – festival organizers can gauge the pulse of the event in real time and make data-driven decisions. This is especially true for electronic music festivals, where a peak-hour dancefloor in Ibiza, a warehouse rave in Berlin, or an EDM festival in Las Vegas all demand careful monitoring to keep the vibe positive and safe.
In this guide, a veteran festival organizer shares hard-earned wisdom on the KPIs that truly matter for electronic events. We’ll explore how to track metrics reflecting dancefloor health – such as crowd density per square meter, queue lengths, water consumption, incident reports, and even noise complaints from neighbors. We’ll also pair these with core business KPIs like ticket sell-through by tier, per-capita spending, and attendee satisfaction scores (NPS and return intent). Finally, we’ll discuss how a live dashboard during show days can empower festival teams to adjust staffing and communications on the fly, ensuring both the crowd and the bottom line are well looked after.
Dancefloor Health Metrics
A packed dancefloor is the sign of a great party – but how packed is too packed? Are attendees waiting too long for entry or drinks? Is everyone staying hydrated? These operational metrics directly impact attendee experience and safety. Here are the critical “dancefloor health” KPIs festival producers should monitor:
Crowd Density (People per Square Meter)
Monitoring crowd density in the main dance areas is vital for safety and comfort. Crowd density is measured as people per square meter, and it indicates how tightly packed the audience is. An ideal density allows room to dance and move; experts note that about 1–2 people per square meter is a typical comfortable crowd density. Once you get above 3–4 people per m², the space starts to become congested and movement becomes difficult. Excessive density not only diminishes the dance experience but can lead to dangerous crowd crush conditions.
Data-Driven Event Marketing
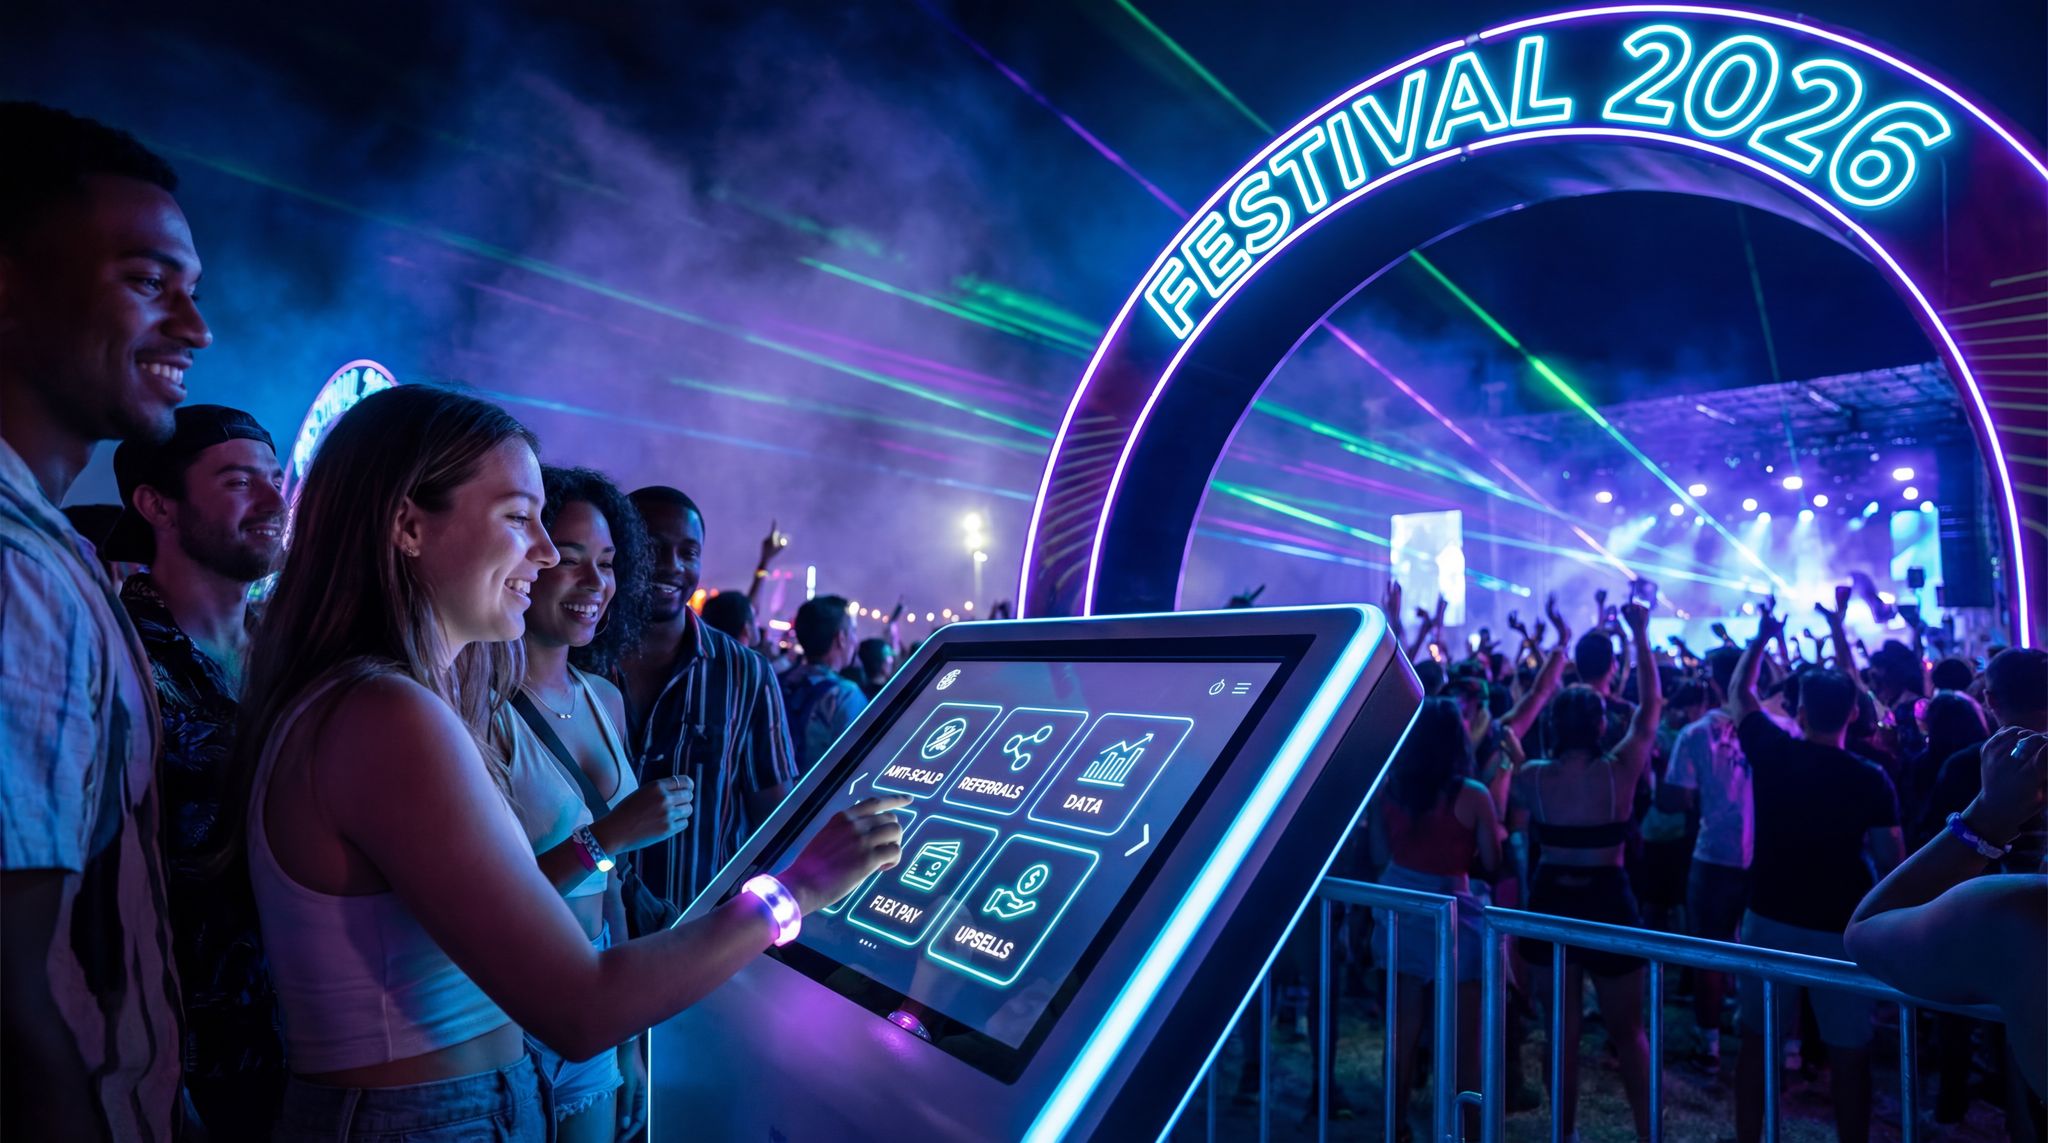
Track ticket sales, demographics, marketing ROI, and social reach in real time. Exportable reports give you the insights to make smarter decisions.
To accurately calculate crowd density per square meter during the site planning phase, organizers divide the total usable floor space by the expected stage capacity. However, during the live event, visual estimations and automated monitoring become critical. A density of two individuals per square meter generally allows attendees to dance freely without bumping shoulders, whereas reaching five people per square meter creates a hazardous, gridlocked environment where dangerous crowd sway can occur.
For example, the Astroworld 2021 tragedy in Texas demonstrated the consequences of unchecked crowding – a crowd surge at the festival led to the deaths of 10 attendees and hundreds of injuries. Likewise, the Halloween 2022 street party in Itaewon, Seoul saw a fatal crush largely due to extremely high density in a confined area. These incidents underscore why real-time crowd monitoring is crucial. Festival organizers should deploy staff or technology (like CCTV analytics or crowd sensors) to track people flow and density on the dancefloor and at other bottlenecks. If a particular stage or area is becoming too packed, take action immediately: pause entry to that zone, open additional space, or signal security teams to regulate flow. Keeping crowd density at safe levels maintains a positive vibe and prevents panic or injury.
Planning a Festival?
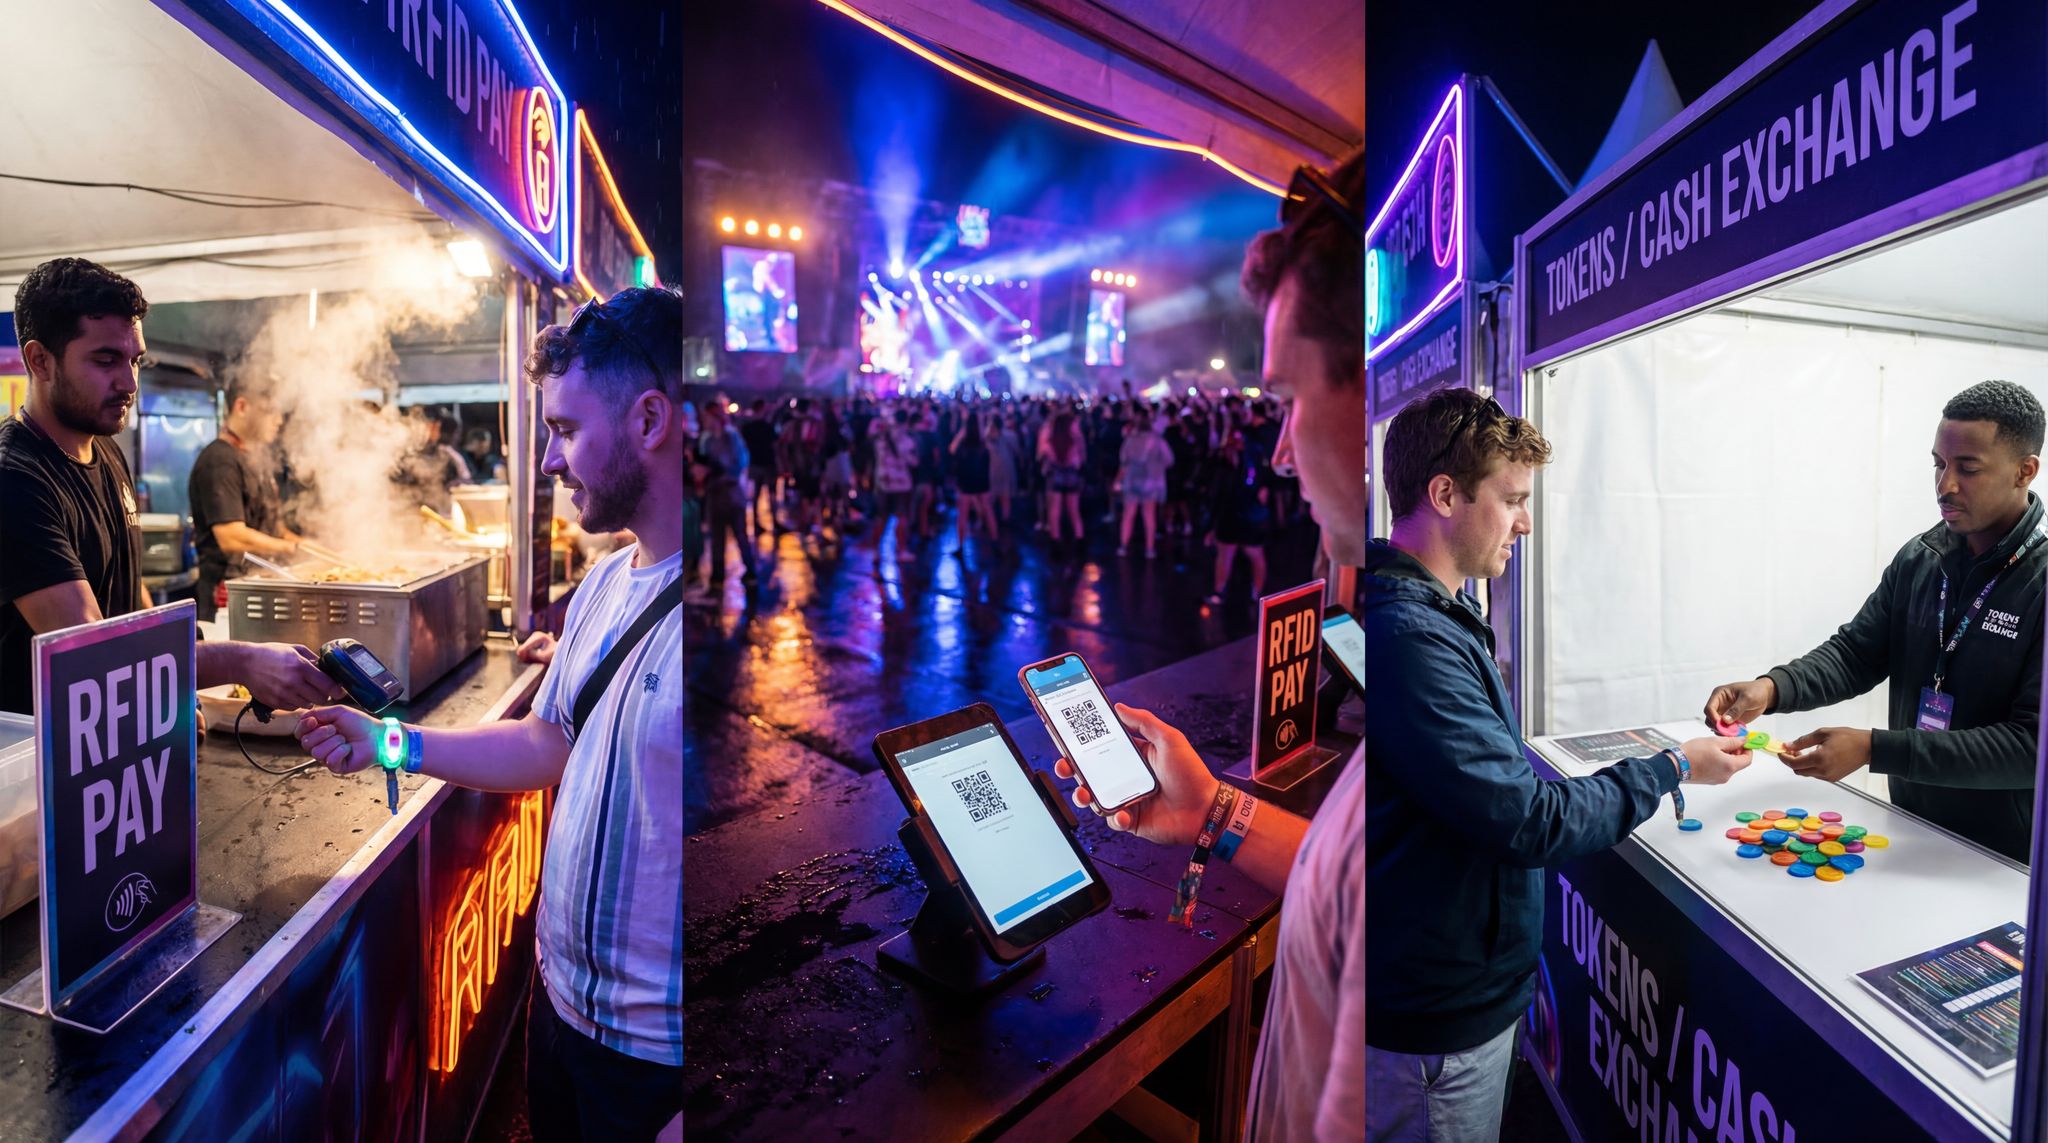
Ticket Fairy's festival ticketing platform handles multi-day passes, RFID wristbands, and complex festival operations.
Queue Times and Wait Lines
Nothing sours an attendee’s mood faster than excessive waiting. Long queues at entry gates, token top-up stations, bar counters, or restrooms can turn excitement into frustration. Queue time is a KPI that reflects your operational efficiency and staffing. Festival producers should measure how long people are waiting at key points and aim to keep those times as low as possible. Industry veterans often set targets (e.g., “no one waits more than 10 minutes for a drink” or “gate queues should clear within 20 minutes of peak arrival”). Monitoring these times in real time allows you to allocate staff or open extra lanes to prevent bottlenecks.
Case in point: Glastonbury Festival 2016 was marred by massive entry delays – traffic jams up to 12 hours just to reach the site. While some factors (like heavy rain and muddy roads) were beyond control, it became a PR nightmare. This taught festival organizers a hard lesson: first impressions count. By the time attendees finally arrived, swift processing at the gates was critical to salvage their experience. Even within the festival, a painfully long line can dampen high spirits. Research in queue psychology shows that when people see a huge snaking line, anticipation can quickly turn into boredom and irritation. Splitting a long line into multiple lanes (and even adding some entertainment) can make the perceived wait much shorter. The bottom line is to track queue lengths and wait times continuously. If your live dashboard shows queue times creeping up, deploy more staff or open additional service points on the fly. A festival organizer in Singapore or Mumbai must be just as vigilant about entry queues as one in California – swift service is a universal key to attendee happiness.
Hydration and Water Usage
In the ecstatic environment of an electronic music event, attendees are dancing hard – often for hours on end – which makes staying hydrated a top priority. Tracking water usage (bottled water sales, refills at free water stations, and even backstage artist water consumption) provides insight into whether your crowd is taking care of themselves. It can also highlight if your water supply and distribution points are sufficient. For example, if free water refill stations show low usage but temperatures are high, attendees might not realize water is available or accessible – a sign to boost your water announcements or improve station visibility.
A useful benchmark: sports medicine experts recommend roughly 1 liter of water per hour for moderate activity in temperate conditions – and dancing at a festival is often far from moderate. In hot climates (think summer in Nevada or Queensland) or packed indoor raves, water needs can be even higher. Monitor how many liters per attendee are being consumed. If you see hydration usage dipping low during a high-intensity set, consider pushing a reminder from the stage or via screens for everyone to drink water. Conversely, a sudden spike in water consumption could indicate rising heat stress – maybe the venue is getting hotter or an outdoor festival’s afternoon sun is peaking – prompting you to distribute more water and activate misting fans.
Boost Revenue With Smart Upsells
Sell merchandise, VIP upgrades, parking passes, and add-ons during checkout and via post-purchase emails. Increase average order value by up to 220%.
Real-world incidents drive home this metric’s importance. During a severe heat wave at EDC (Electric Daisy Carnival) Las Vegas, nearly 1,100 people sought medical help over three days – almost double the usual number of medical incidents, attributed largely to 40 °C (104 °F) heat. Extreme conditions, hours of dancing, and possible substance use can create a perfect storm for dehydration, so measuring water uptake and responding with additional cooling or hydration measures can literally save lives. At many Australian bush doofs and European summer festivals, organizers schedule regular “water breaks” and have roaming teams hand out water – informed by on-site metrics and past data on how quickly the crowd goes through H?O.
Incident Rates and Safety Metrics
Every festival should have a safety dashboard tracking incident rates – which include medical incidents (heat exhaustion, injuries, allergic reactions), security issues (fights, harassment, lost persons), and any other reportable safety occurrences. This KPI is often measured as the number of incidents per 1,000 attendees or simply total incidents per hour. Watching this number in real time helps a festival producer detect early warning signs of trouble. For instance, if you suddenly get a cluster of heatstroke cases in one hour, it’s a red flag that you need to cool down that area or remind people to rest and rehydrate. If security reports more altercations than usual at a specific stage, maybe the crowd density or artist messaging needs attention.
Need Festival Funding?
Get the capital you need to book headliners, secure venues, and scale your festival production.
It’s also insightful to categorize incidents by type and location. A pattern of incidents can highlight underlying causes – e.g., a particular bass-heavy stage might see more minor injuries from intense dancing (so you ensure medics are stationed nearby), or a certain vendor area could be causing allergic reactions. By measuring incident rate trends, you can intervene before something escalates.
Many large festivals pride themselves on robust safety responses. Tomorrowland in Belgium, for example, has medical tents in each zone and tracks metrics like response time and cases handled. On the flip side, failing to manage incidents can have dire consequences. After-action data from past events show that most disasters build up warning signs first. The crowd crush at Astroworld had multiple people collapsing before the big surge happened – a real-time incident tracker might have alerted staff to intervene sooner. If your festival sees an unusual spike in distress calls or security alerts, don’t wait – slow the music, pause the show if needed, flood the zone with staff, and get things under control. The best festival organizers from Mexico City to Mumbai all share one trait: they treat safety stats as gospel during the show.
Beyond medical and crowd-flow issues, physical infrastructure integrity is a critical safety metric. Monitoring your perimeter security fencing is just as important as watching the dancefloor. Festival producers should track perimeter breaches or fence-line incidents as a specific KPI. Whether you are working with a specialized perimeter security fencing manufacturer or renting standard infrastructure perimeter fencing, logging how well these barriers hold up against crowd pressure or unauthorized entry attempts helps you evaluate your site design. If a specific zone experiences repeated fence jumping, you know exactly where to reinforce infrastructure or deploy additional guards for the next day.
Noise Levels and Neighbor Complaints
Electronic music festivals are known for booming sound systems – great for fans, not so great for the neighbors down the street. Noise complaints from local residents and authorities are an important KPI, especially for urban or suburban venues. Many countries have strict sound regulations; for example, outdoor events in the UK often must wrap up live music by 11:00 pm due to residential noise curfews. Each noise complaint call that comes in is a metric of how well you’re balancing an epic sound experience with community respect.
Festival producers should track not only decibel levels at the perimeter in real time, but also the number of complaint calls received. Some events set up a special community hotline; others coordinate with local authorities who log or forward complaint counts. Too many noise complaints can jeopardize your festival’s future – authorities might slap on stricter sound limits or shorter hours next year if data shows last event generated excessive grievances. As a precaution, smart festival teams engage in sound level monitoring throughout the event. For instance, a sound consultant at a UK festival described being on-site 24/7 with a sound level meter, adjusting stage volumes live to ensure compliance. Using such tools, you can dynamically tweak sound direction and volume when readings (or complaints) spike – for example, lowering bass frequencies after midnight or redirecting speakers.
It’s also wise to log when and where complaints happen. If neighbors only complain after 10 pm, perhaps a minor curfew or a silent disco option for late-night sets could solve it. If one side of the venue produces most issues, invest in better sound baffling on that perimeter. The key is to treat the surrounding community as stakeholders in your event’s success – measure their satisfaction (or irritation) just as you do attendees’. Festivals in dense cities like Barcelona or Sydney have learned to work closely with residents, using real-time noise dashboards and even distributing free tickets or souvenirs to build goodwill. The fewer angry phone calls during your event, the better your odds of a happy return next year.
Commercial KPIs for Festival Success
Operational metrics alone don’t tell the full story of an event’s performance. Festival organizers also need to keep an eye on commercial KPIs to ensure the festival is financially viable and that fans are eager to come back. These metrics include ticket sales dynamics, attendee spending, and satisfaction indicators. For an electronic music festival – whether a boutique techno night for 500 people or a massive multi-stage EDM weekend for 100,000 – combining these business metrics with the “dancefloor health” metrics above gives a 360° view of your event. Here are the key commercial KPIs to track:
Ticket Sell-Through by Tier
Most festivals sell tickets in tiers or phases (Early Bird, Phase 1, Phase 2, VIP, etc.), and each tier’s performance is rich with information. Sell-through by tier means analyzing what percentage of tickets in each category have sold (and how quickly they sold out). Tracking this helps you understand demand and pricing effectiveness. For example, if your Early Bird tickets (often the cheapest) sold out in minutes while a higher-priced Tier 3 is only 50% sold a month later, that’s a clear signal about pricing or perceived value. A strong early sell-through might indicate loyal fans and excitement (great for planning future capacity); sluggish final-tier sales might suggest you pushed prices a bit too high or saturated your market.
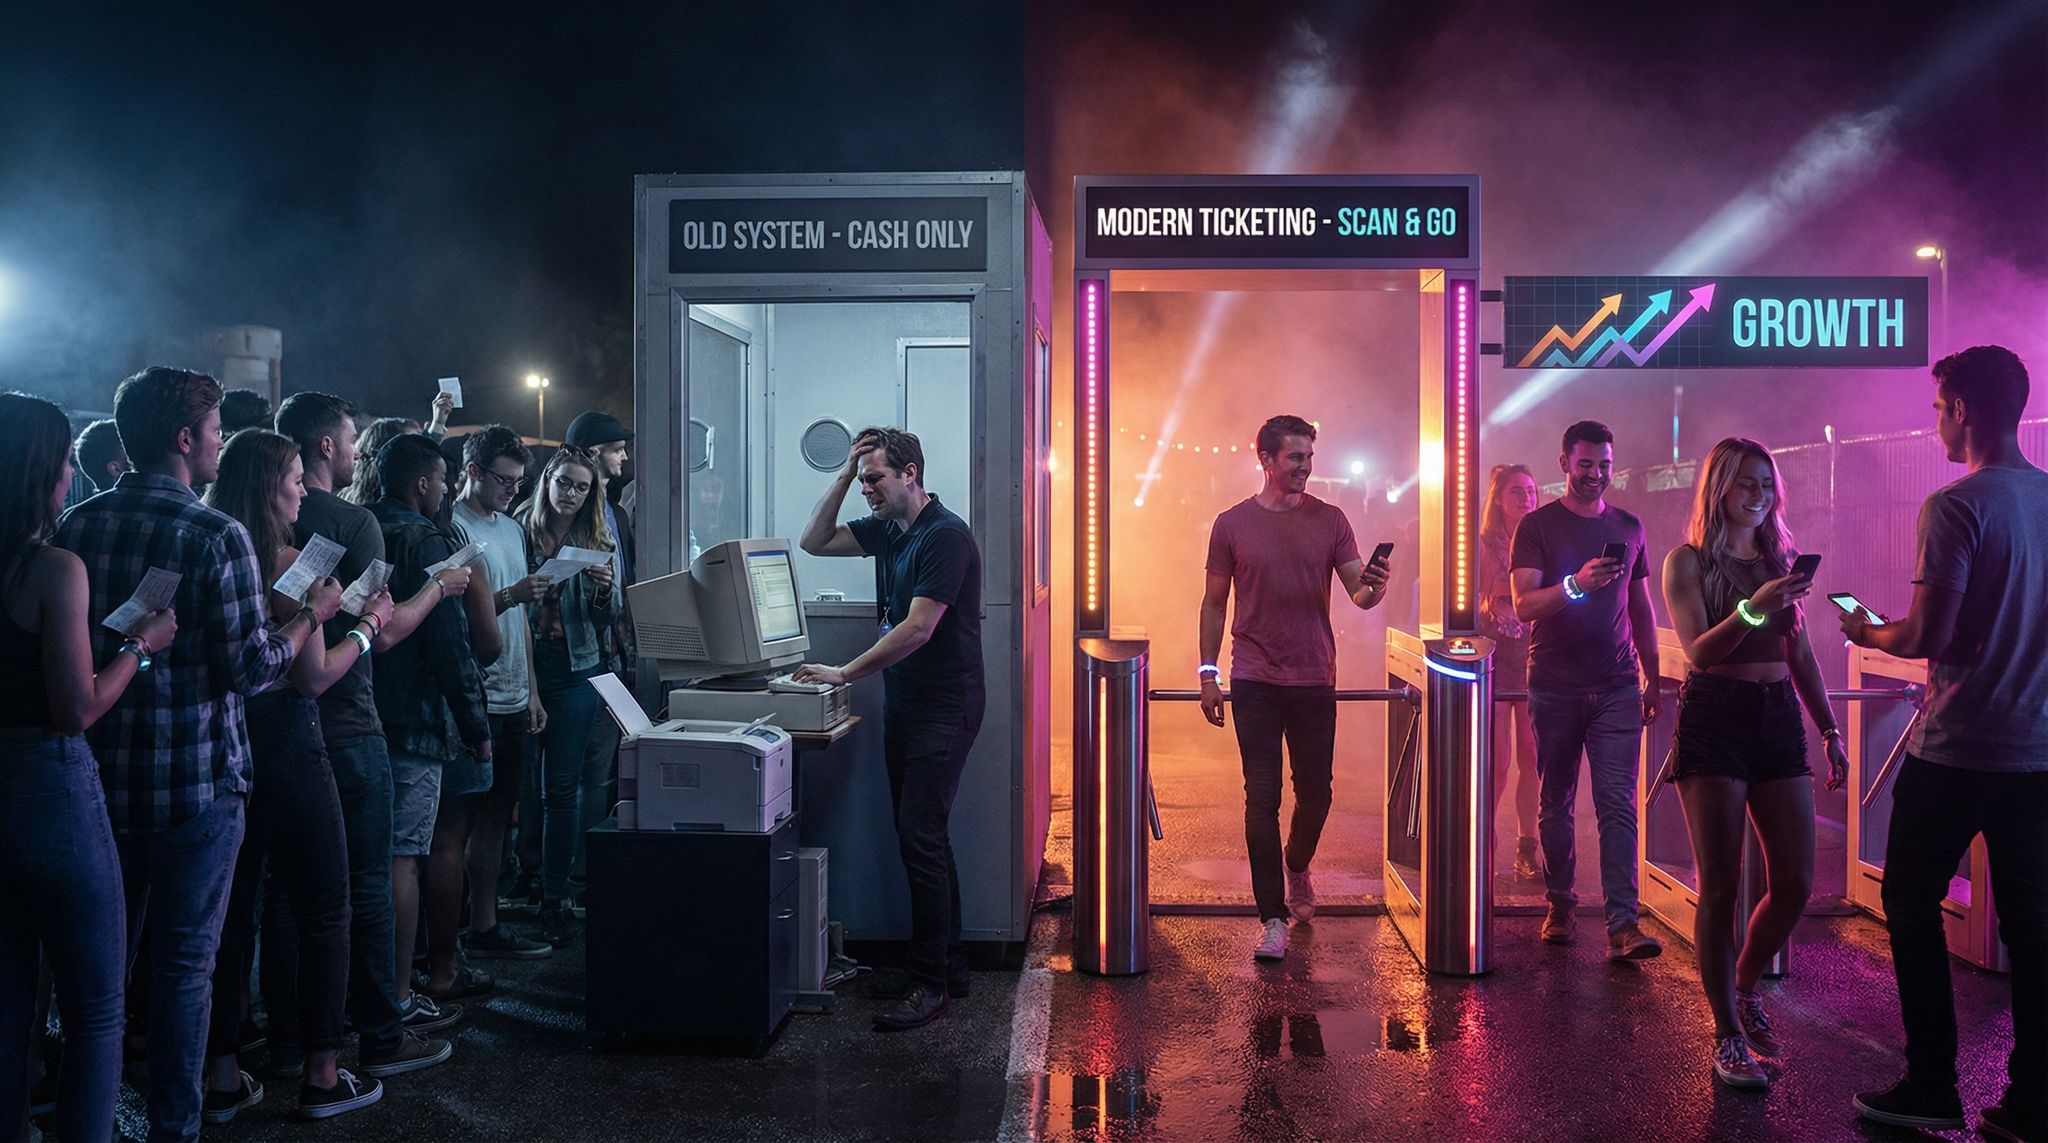
Festival producers should monitor sell-through regularly (even daily during on-sale peaks) in the lead-up to the event. A live sales dashboard can show sales velocity – the rate at which tickets are being bought at each tier – allowing you to adjust marketing pushes in real time. Say your VIP tickets are lagging; you might launch a promo or add VIP perks to boost their appeal. Or if a certain region’s sales (e.g., fans from Germany vs. the UK) are slower, you could target ads there. During the event itself, ticket sell-through data helps with final gate planning (knowing how many attendees to expect each day and in each category) and is a big part of your post-event analysis for next year’s strategy. Modern ticketing platforms like Ticket Fairy make it easy to track tier-wise sales in real time, so festival organizers from New Zealand to Spain can make informed decisions on pricing and marketing without guesswork.
For venue operators and promoters managing multiple events, ticket data also serves as a foundational metric for broader performance analysis. Consider a common scenario when analyzing a database of information about shows at a concert venue: if you only have the total dollar amount of all tickets sold and the date, determining the artist with the greatest attendance requires one crucial additional piece of information—the average ticket price. By dividing the total gross by the average ticket price, organizers can accurately calculate crowd size even when direct scan counts are unavailable. This fundamental math is a cornerstone of revenue tracking across the live music sector.
Per-Capita Spending (On-Site Revenue per Attendee)
Beyond ticket sales, the per-capita spend of attendees on site is a make-or-break number for festival profitability. This KPI calculates the average amount each attendee spends on food, beverages, merchandise, and other on-site purchases. For instance, if you have 5,000 attendees and your total food, drink, and merch revenue is $250,000, then the average per-capita spend is $50. Event organizers worldwide use this metric to gauge how well they are monetizing the event experience beyond just ticket entry.
Different festival audiences have different spending patterns. A big-room EDM festival in Las Vegas or an Australian outback bush doof might see attendees splurging on drinks and festival-branded merch, whereas a smaller techno night in Berlin’s underground scene may have lower spend per head (especially if the crowd is younger or the event is shorter). It’s valuable to compare your per-capita spend against benchmarks from past events or industry averages. Globally, festival-goers have been known to shell out significant sums – one international survey found U.S. music festival attendees spend on average €578 (around $600) per festival trip, among the highest in the world. While that figure includes external costs, on-site spending is a big component of it.
Track per-cap spend in real time during the show: many cashless payment systems or POS vendors provide up-to-the-minute sales data. If by mid-festival you notice attendees aren’t spending as much as expected (perhaps merch sales are slow or bar lines are oddly short), you can react – maybe promote a flash sale at the merch booth, push a 2-for-1 late-night snack deal, or deploy roving vendors into the crowd. Conversely, if people are spending more than anticipated, you might need to reorder supplies (restock water, beer, glow sticks, etc.) to meet demand. A live view of per-capita revenue also helps with inventory and vendor management during the event. By maximizing per-capita spend (ethically, of course – always provide value for money), festivals can boost their margins without needing to raise ticket prices beyond attendees’ comfort levels.
Attendee Satisfaction and Loyalty (NPS & Return Intent)
At the end of the day (or night), the success of an electronic music festival hinges on attendee satisfaction – did people have such a great experience that they will rave about it (pun intended) and return for the next one? To quantify this, producers use metrics like Net Promoter Score (NPS) and stated return intent. NPS is a widely used measure of customer satisfaction and loyalty, applied in events by asking attendees “How likely are you to recommend this festival to a friend?” on a 0–10 scale. Respondents who score 9–10 are “Promoters,” 0–6 are “Detractors,” and 7–8 are passive. Subtracting the percentage of Detractors from Promoters gives an NPS between -100 and +100. A high NPS means your attendees loved the event enough to promote it – a strong predictor of word-of-mouth growth.
Return intent is measured by asking attendees if they would attend again or how likely they are to buy a ticket for your future events. This can be part of a post-event survey or polled informally on social media during/after the festival. Both NPS and return intent capture the overall success of the event from the audience’s perspective. They roll up intangible factors – the lineup, the production quality, crowd management, the “vibe,” and value for money.
To improve these scores, tie them back to the operational KPIs discussed earlier. Often, low satisfaction scores can be traced to pain points like long queues, inadequate facilities, or safety issues. For example, if your post-event survey shows many people wouldn’t return because “the bar lines were too long” or “sound quality was poor,” those are clear directives on what to fix. Top festivals in North America, Europe, and Asia alike are now closing the feedback loop: using NPS data and attendee feedback to tweak everything from logistics to artist curation for next year. Some even monitor social media sentiment during the festival as a kind of real-time pulse on satisfaction – if day-one Twitter chatter complains about overcrowding at Stage B, the team can react on day two by improving that situation. High satisfaction and loyalty metrics are the ultimate KPIs, because they indicate not just a one-time win but the sustainability of your festival brand through repeat attendance and positive reputation.
Real-Time Dashboard: Turning Data into Action
Having all these metrics is useless if they’re not monitored and acted upon when it counts – during the event. That’s why leading festival producers set up a live dashboard or command center that consolidates key KPIs in real time. Think of it as an airplane cockpit instrument panel, but for a festival: at a glance, you can see the “vital signs” of your event and steer it proactively rather than reactively.
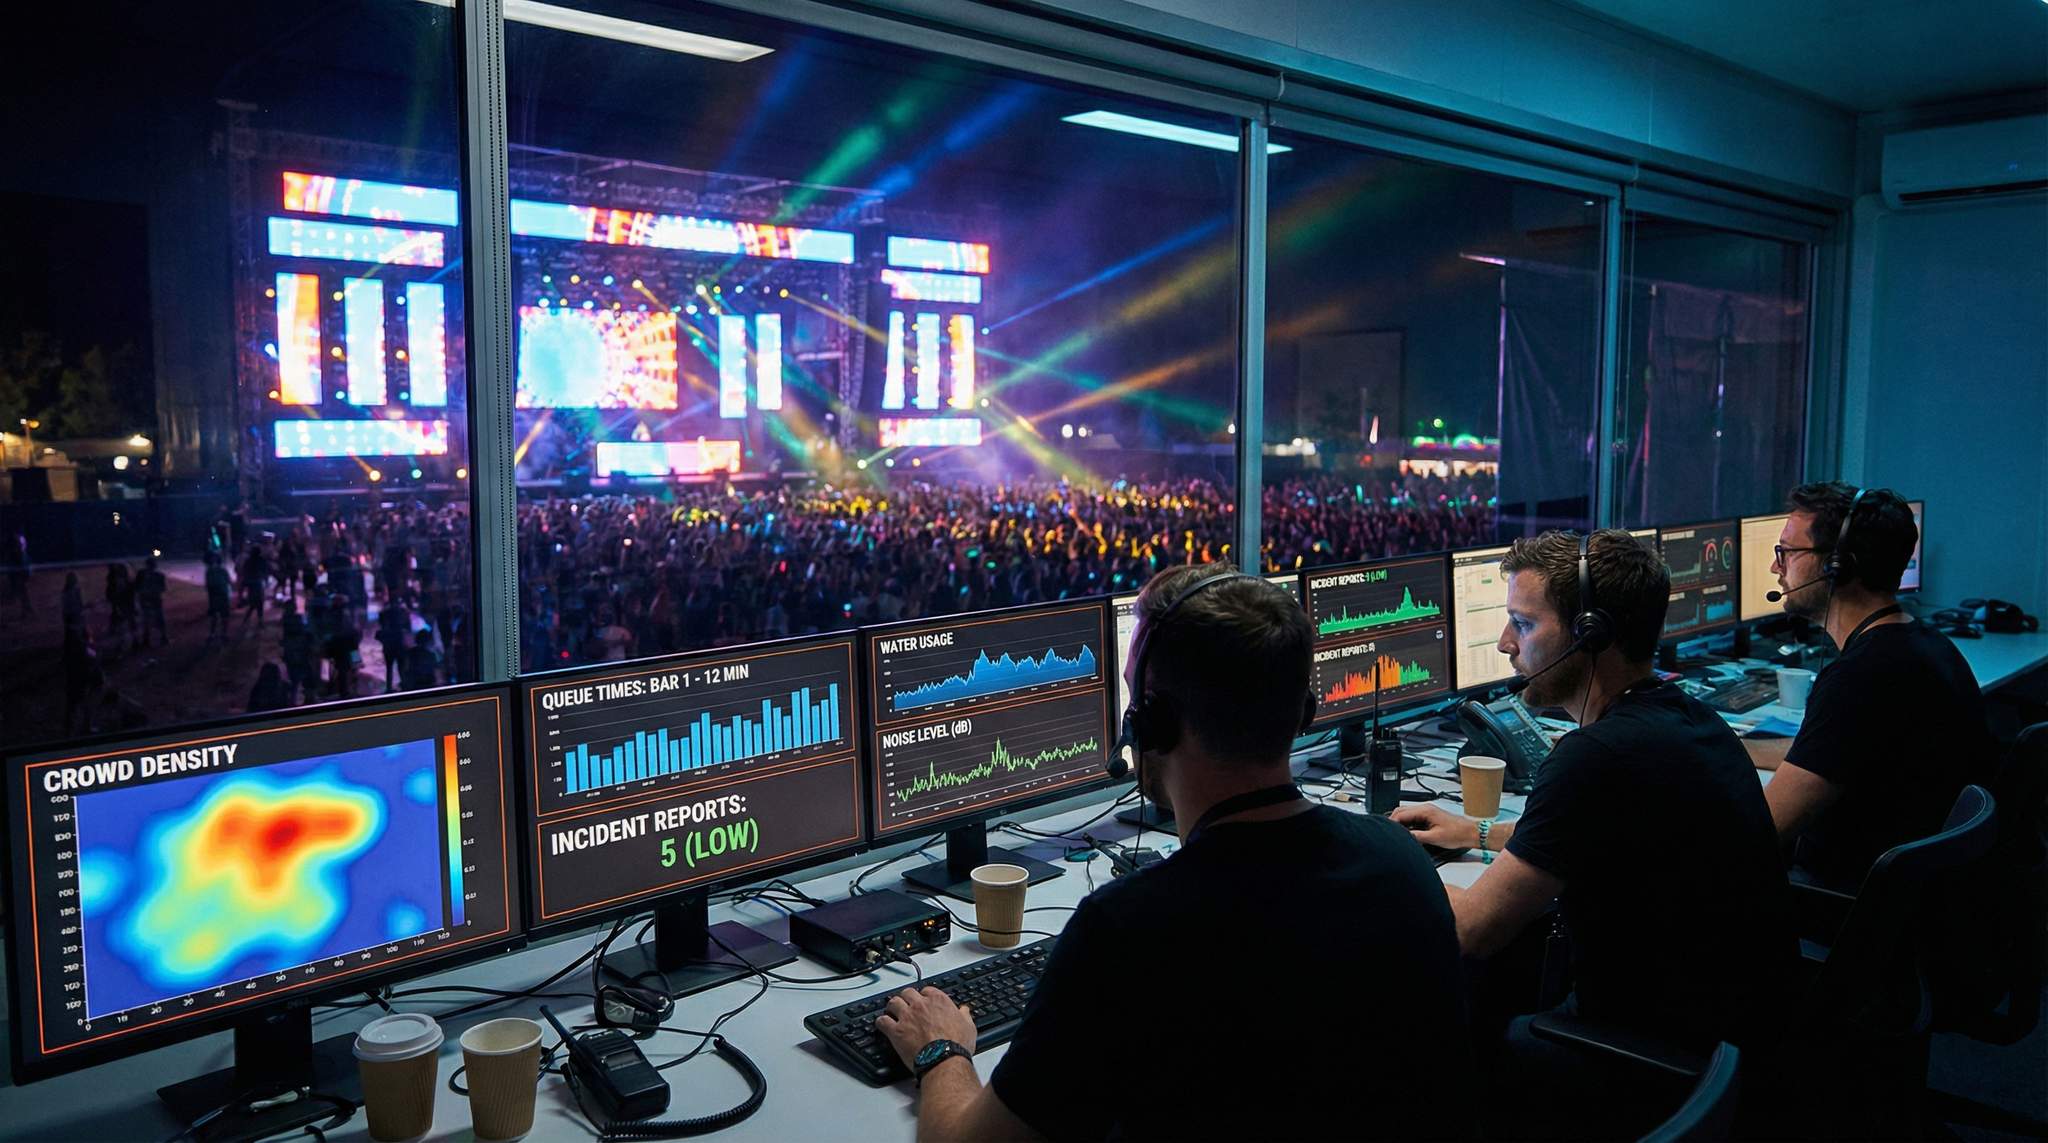
What might a festival’s live dashboard display? It can show entry throughput (e.g. how many people are scanning in per minute at each gate), current crowd density heat maps by zone (if available via cameras or Wi-Fi tracking), average queue times at vendors and toilets (perhaps manually input by area managers or via sensors), water station usage (from IoT sensors or staff counts), live incident reports from security and medical teams, and even metrics like noise levels at the perimeter. Additionally, commercial data like ongoing ticket scan counts vs. expected attendance, real-time sales at concessions, and social media sentiment analysis can be included. A platform like Ticket Fairy can feed some of this data directly – for instance, real-time ticket scans tell you exactly how many people are on site at any given moment, and live sales updates for on-site spending can integrate if your vendors use connected POS systems.
The benefit of a live dashboard is that it enables real-time interventions. If the dashboard flags that Gate 2’s queue time just hit 30 minutes, operations can immediately deploy more staff to that gate or open an additional lane to speed things up. If crowd density in the House/Techno tent is reaching unsafe levels, you can pause admissions to that area or signal the stage manager to momentarily delay the next act until things thin out. If noise levels at the west fence exceed the decibel limit, you radio the audio engineer to dial it down before city officials intervene. Essentially, festival management moves from passively monitoring to actively steering the event.
Communication is key here: ensure that your ops team, security, medical, and even stage production crews are all tied into the command center. Regular check-ins or headset comms should relay what the data means (“We’re seeing a lot of heat exhaustion at Stage X, let’s distribute free water there and have the DJ remind folks to cool down for a minute”). At large-scale events like Tomorrowland or Ultra Music Festival, the organizing teams have centralized control rooms with wall screens and real-time feeds, allowing them to adapt scheduling, staffing, and announcements on the fly. But even a smaller 1,000-person event can set up a mini dashboard – even if it’s just a shared spreadsheet that team members update – to log key stats during the show.
Finally, remember that data from your live dashboard isn’t just for emergency response; it’s also recording a wealth of information for your post-event analysis. The team should review how the KPIs trended: when was the dancefloor most packed, what were the peak wait times, how many medical incidents occurred and when, what was the final per-capita spend, etc. These insights feed into planning your next festival – perhaps you’ll decide to cap capacity lower to improve crowd comfort, or invest in more water refill stations, or open doors earlier to spread out entry lines. In short, measuring what matters – and acting on it in real time – is the secret sauce behind festivals that not only thrill the crowd but also run like a well-oiled machine.
Aligning with Broader Entertainment Industry KPIs
While electronic music festivals have unique operational demands, the metrics we track are deeply rooted in the standard KPIs for the entertainment industry at large. Whether you are running a multi-day outdoor festival, managing a permanent concert venue, or producing a touring theatrical show, the core objectives remain the same: maximizing revenue, ensuring patron safety, and delivering an unforgettable experience. In the wider entertainment sector, metrics like per-capita spending, customer acquisition cost (CAC), and Net Promoter Score are universal benchmarks of health.
By adopting these overarching entertainment industry KPIs, festival organizers can speak the same language as institutional investors, brand sponsors, and municipal partners. When you can demonstrate that your event not only packs the dancefloor but also hits rigorous corporate benchmarks for operational efficiency and audience retention, you elevate your festival from a passionate grassroots project to a highly investable entertainment property.
Frequently Asked Questions
What is a safe crowd density for electronic music festivals?
A safe and comfortable crowd density typically ranges from 1 to 2 people per square meter. Danger arises when density exceeds 3 to 4 people per square meter, leading to congestion and potential crowd crush risks. Festival organizers must monitor these levels continuously to regulate flow and maintain a safe dancefloor environment.
How much water should festival attendees drink while dancing?
Experts recommend drinking roughly 1 liter of water per hour during moderate activity, though intense dancing and hot weather often increase this requirement. Monitoring water consumption helps organizers detect dehydration risks early. If usage drops or heat spikes, festivals can deploy misting fans or distribute free water to prevent medical incidents.
What is per-capita spending in the context of festivals?
Per-capita spending measures the average revenue generated per attendee on food, beverages, and merchandise during the event. This commercial KPI is calculated by dividing total on-site sales by the number of attendees. Tracking this figure helps organizers manage inventory levels and evaluate the financial success of the festival beyond ticket sales.
Why is monitoring queue times critical for event success?
Excessive queue times at gates, bars, or restrooms significantly reduce attendee satisfaction and can turn excitement into frustration. By tracking wait times in real time, organizers can identify bottlenecks and immediately deploy extra staff or open additional lanes. Keeping waits short, such as under 20 minutes for entry, ensures a positive guest experience.
How does a live dashboard assist festival operations?
A live dashboard centralizes real-time metrics like crowd density, entry throughput, and incident reports, enabling immediate operational adjustments. Instead of reacting after a problem escalates, teams can proactively manage safety by pausing entry to packed zones or redirecting resources. This tool allows for data-driven decisions that protect both the crowd and the bottom line.
What is the Net Promoter Score for music festivals?
Net Promoter Score (NPS) quantifies attendee loyalty by asking how likely they are to recommend the festival to friends on a 0–10 scale. High scores indicate strong word-of-mouth potential and a healthy brand, while low scores highlight areas for improvement. This metric, combined with return intent, helps organizers gauge overall event success and sustainability.
What are the standard KPIs for the entertainment industry?
Standard KPIs for the entertainment industry include ticket sell-through rates, per-capita spending, Net Promoter Score (NPS), and safety incident rates. These metrics help venue operators and event producers measure financial viability, audience satisfaction, and operational efficiency across concerts, festivals, and other live events.
How do you calculate crowd density per square meter for a festival stage?
To calculate crowd density per square meter, divide the total number of attendees in a specific zone by the usable floor area (in square meters) of that zone. For example, 2,000 people in a 1,000-square-meter viewing area results in a density of 2 people per square meter. Organizers use this baseline during site planning and monitor it live using camera analytics to ensure the dancefloor remains safe and comfortable.